
Dental Health Ranked by State 2024
National dental provider Express Dentist, the website for finding an emergency dentist near you, has ranked all 50 states and the District of Columbia based on their dental health. The comprehensive study examined 25 indicators of dental health, including percentage of adults who visit the dentist and number of dentists per 100,000 people.
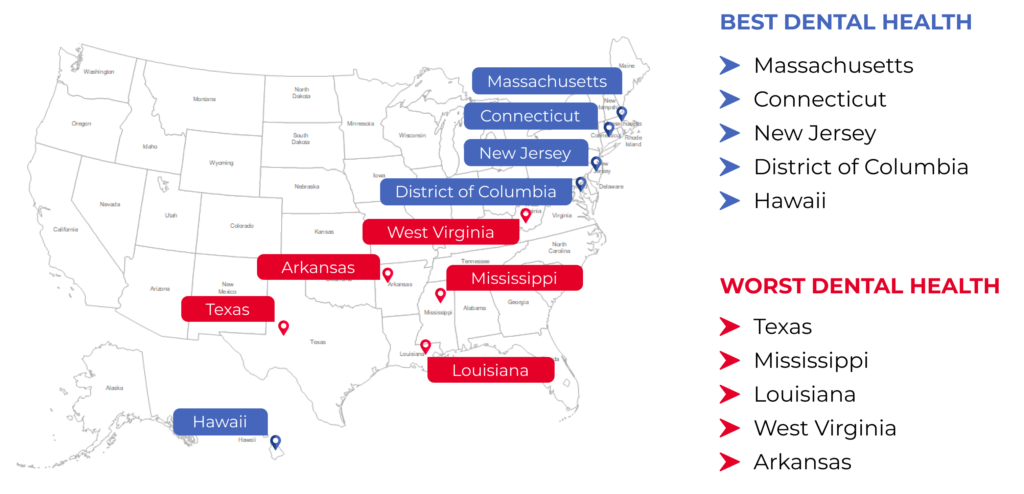
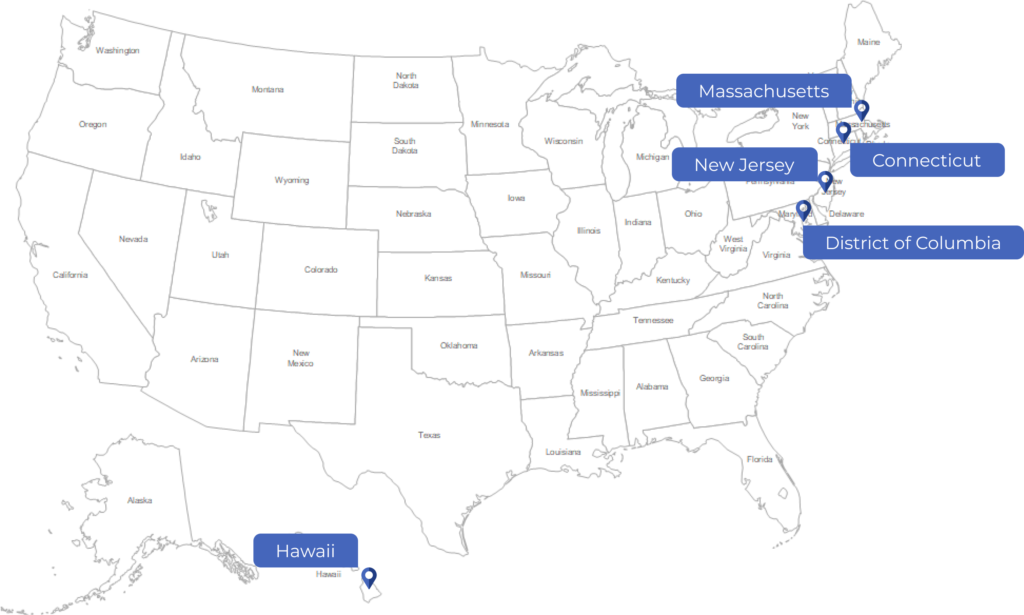
Connecticut has the best dental health, followed by the District of Columbia, Massachusetts, Hawaii and New Jersey. Among other factors, residents in these states report lower levels of dental pain in the last 12 months than those elsewhere in the United States.
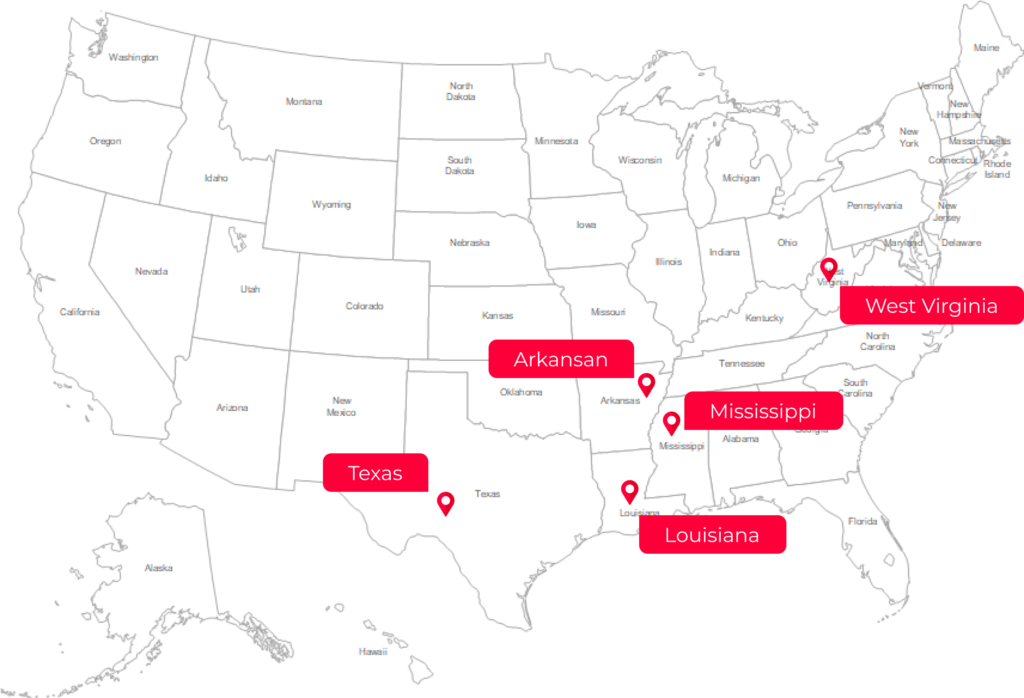
Arkansas has the worst dental health, followed by West Virginia, Louisiana, Mississippi and Texas. These states have higher numbers of residents taking days off work for dental pain, which suggests that poor dental health can have a direct impact on economic productivity.
|
States with best dental health |
States with worst dental health |
|
1. Connecticut |
42. Kentucky |
|
2. District of Columbia |
43. Maine |
|
3. Massachusetts |
44. Montana |
|
4. Hawaii |
45. Alabama |
|
5. New Jersey |
46. Alaska |
|
6. Illinois |
47. Texas |
|
7. Washington |
48. Mississippi |
|
8. Iowa |
49. Louisiana |
|
9. Michigan |
50. West Virginia |
|
10. Ohio |
51. Arkansas |
Some parts of the United States have a higher density of dental professionals, which makes not only access to dental care easier but also more affordable. Another locational factor that affects the health of your teeth is the availability of fluoridated water which is important to prevent tooth decay. While some states provide fluoridated water to nearly all residents, others lag behind. Coverage for dental care also varies from state to state with some states providing no coverage under Medicaid and others providing limited, emergency, or extensive coverage.
Then there are habitual trends as well. In some US states, a large percentage of people state they avoid visiting the dentist because they are afraid. Some states have a large percentage of people who understand the importance of preventive dental care, while others lag behind.
Given that many people have been hesitant to visit the dentist for routine care during the COVID-19 pandemic, it is now more important than ever to understand what your geographical location could mean for the health of your teeth and gums. In order to find out which states in the US are the best and worst in terms of oral health, Express Dentist compared the 50 states and the District of Columbia using 25 key metrics, ranging from availability of care to costs to habits. Here’s what we found… the best and worst states in terms of oral health in the US. To find a dentist near you, get in touch with Express Dentist.
Table of Contents
State Rankings
| Rank | Total score out of 100 | Number of dentists per 100,000 people | Employment level in dentists | Percentage of all adults who reported visiting a dentist in the past year | Percentage of young adults (ages 18-44) who visited a dentist in the past year | Percentage of adults aged 65 or older who reported having all teeth removed due to decay or gum disease | Medicaid Adult Dental Benefits | Water Fluoridation | Reason for not visiting a dentist among those without a visit in the past 12 months – Cost | Percentage of adults who reported smoking at least 100 cigarettes in their lifetime and currently smoke daily or some days | Percentage of children ages 1-17 who had one or more preventive dental care visits in the past 12 months | Poor overall condition of mouth and teeth among all income levels | Poor overall condition of mouth and teeth among low income level | Very good overall condition of mouth and teeth among all income levels | Life in general is very often less satisfying due to condition of mouth and teeth among all income levels | Life in general is very often less satisfying due to condition of mouth and teeth among low-income level | Life in general is never less satisfying due to condition of mouth and teeth among high-income level | Appearance of mouth and teeth affect ability to interview for a job among all income levels | Appearance of mouth and teeth affect ability to interview for a job among low-income level | Experienced dry mouth very often in the last 12 months due to condition of mouth and teeth among all income groups | Experienced difficulty biting/chewing very often in the last 12 months due to condition of mouth and teeth among all income groups | Experienced pain very often in the last 12 months due to condition of mouth and teeth among all income groups | Took days off very often in the last 12 months due to condition of mouth and teeth among all income groups | Strongly agree with I need to see the dentist twice a year among all income groups | Reason for not visiting a dentist among those without a visit in the last 12 months – Trouble finding a dentist | Reason for not visiting a dentist among those without a visit in the last 12 months – Afraid of dentist | |
| Connecticut | 1 | 86 | 4 | 2 | 4 | 3 | 4 | 4 | 4 | 4 | 3 | 4 | 3 | 3 | 3 | 4 | 3 | 4 | 4 | 3 | 3 | 3 | 4 | 3 | 3 | 4 | 3 |
| District of Columbia | 2 | 82 | 4 | 3 | 3 | 4 | 3 | 4 | 4 | 4 | 3 | 3 | 3 | 4 | 2 | 4 | 4 | 1 | 4 | 3 | 4 | 4 | 4 | 3 | 2 | 2 | 3 |
| Massachusetts | 3 | 79 | 4 | 3 | 3 | 3 | 3 | 4 | 3 | 3 | 3 | 3 | 3 | 3 | 2 | 4 | 2 | 3 | 4 | 3 | 4 | 3 | 4 | 4 | 3 | 3 | 2 |
| Hawaii | 4 | 78 | 4 | 2 | 4 | 3 | 4 | 2 | 1 | 4 | 3 | 4 | 4 | 3 | 3 | 4 | 3 | 2 | 4 | 2 | 4 | 3 | 3 | 3 | 3 | 3 | 3 |
| New Jersey | 5 | 77 | 4 | 4 | 3 | 2 | 4 | 4 | 1 | 4 | 3 | 3 | 4 | 3 | 3 | 4 | 3 | 3 | 3 | 1 | 4 | 3 | 3 | 4 | 2 | 2 | 3 |
| Illinois | 6 | 76 | 3 | 4 | 2 | 2 | 3 | 4 | 4 | 2 | 3 | 2 | 3 | 2 | 4 | 4 | 2 | 4 | 4 | 2 | 4 | 4 | 4 | 4 | 2 | 1 | 3 |
| Washington | 7 | 76 | 4 | 4 | 2 | 2 | 4 | 4 | 3 | 3 | 3 | 3 | 3 | 2 | 3 | 4 | 2 | 4 | 4 | 3 | 3 | 2 | 4 | 4 | 2 | 2 | 2 |
| Iowa | 8 | 74 | 2 | 2 | 3 | 2 | 3 | 4 | 4 | 4 | 2 | 3 | 4 | 4 | 2 | 4 | 2 | 2 | 4 | 4 | 1 | 3 | 4 | 3 | 2 | 3 | 3 |
| Michigan | 9 | 74 | 2 | 4 | 3 | 2 | 3 | 3 | 4 | 3 | 2 | 2 | 3 | 2 | 3 | 4 | 2 | 4 | 4 | 4 | 3 | 3 | 3 | 4 | 3 | 2 | 2 |
| Ohio | 10 | 74 | 2 | 4 | 2 | 2 | 2 | 4 | 4 | 3 | 1 | 1 | 4 | 4 | 3 | 4 | 3 | 3 | 4 | 3 | 4 | 3 | 4 | 4 | 3 | 1 | 2 |
| Minnesota | 11 | 72 | 2 | 3 | 3 | 3 | 4 | 3 | 4 | 3 | 3 | 2 | 3 | 3 | 2 | 4 | 2 | 3 | 4 | 3 | 4 | 3 | 3 | 3 | 2 | 1 | 2 |
| New York | 12 | 72 | 4 | 4 | 2 | 2 | 3 | 4 | 3 | 4 | 3 | 2 | 4 | 3 | 2 | 3 | 3 | 2 | 4 | 4 | 3 | 2 | 3 | 2 | 2 | 1 | 3 |
| North Dakota | 13 | 71 | 2 | 1 | 2 | 2 | 3 | 4 | 4 | 2 | 2 | 1 | 3 | 3 | 2 | 4 | 4 | 3 | 4 | 3 | 3 | 3 | 4 | 4 | 2 | 3 | 3 |
| Wisconsin | 14 | 71 | 2 | 3 | 3 | 2 | 3 | 4 | 4 | 3 | 2 | 2 | 3 | 1 | 3 | 4 | 2 | 4 | 4 | 2 | 4 | 3 | 3 | 4 | 2 | 1 | 3 |
| Rhode Island | 15 | 70 | 2 | 1 | 3 | 2 | 3 | 4 | 4 | 4 | 3 | 2 | 4 | 3 | 2 | 4 | 2 | 2 | 3 | 4 | 3 | 3 | 3 | 4 | 2 | 1 | 2 |
| Maryland | 16 | 69 | 4 | 3 | 2 | 1 | 3 | 1 | 4 | 3 | 3 | 3 | 3 | 2 | 3 | 3 | 2 | 4 | 4 | 3 | 3 | 2 | 3 | 2 | 3 | 3 | 2 |
| Nebraska | 17 | 69 | 3 | 1 | 2 | 1 | 3 | 3 | 3 | 3 | 3 | 3 | 4 | 3 | 3 | 3 | 2 | 4 | 4 | 3 | 4 | 2 | 3 | 1 | 2 | 4 | 2 |
| Pennsylvania | 18 | 69 | 2 | 4 | 2 | 2 | 2 | 3 | 3 | 2 | 2 | 2 | 4 | 2 | 3 | 4 | 2 | 4 | 3 | 3 | 3 | 4 | 3 | 4 | 3 | 2 | 1 |
| Colorado | 19 | 68 | 3 | 3 | 2 | 1 | 4 | 4 | 3 | 2 | 3 | 3 | 3 | 3 | 2 | 3 | 3 | 3 | 4 | 4 | 3 | 2 | 3 | 1 | 2 | 2 | 2 |
| North Carolina | 20 | 68 | 2 | 4 | 2 | 2 | 2 | 4 | 4 | 1 | 2 | 2 | 3 | 3 | 2 | 3 | 3 | 3 | 4 | 2 | 3 | 2 | 3 | 3 | 3 | 2 | 4 |
| Utah | 21 | 68 | 3 | 3 | 3 | 3 | 3 | 2 | 3 | 3 | 4 | 3 | 3 | 3 | 3 | 2 | 2 | 2 | 4 | 3 | 4 | 1 | 2 | 1 | 2 | 3 | 3 |
| Vermont | 22 | 68 | 2 | 1 | 3 | 3 | 2 | 3 | 3 | 3 | 2 | 3 | 4 | 2 | 3 | 4 | 2 | 3 | 4 | 3 | 3 | 2 | 3 | 2 | 3 | 2 | 3 |
| Idaho | 23 | 67 | 2 | 2 | 2 | 1 | 3 | 4 | 2 | 2 | 2 | 3 | 4 | 3 | 3 | 4 | 3 | 1 | 3 | 2 | 4 | 3 | 3 | 4 | 2 | 2 | 3 |
| South Dakota | 24 | 67 | 2 | 1 | 2 | 2 | 3 | 3 | 4 | 4 | 2 | 2 | 3 | 2 | 2 | 4 | 3 | 1 | 3 | 3 | 4 | 3 | 4 | 3 | 1 | 3 | 3 |
| Virginia | 25 | 67 | 3 | 4 | 3 | 2 | 3 | 2 | 4 | 2 | 3 | 2 | 3 | 1 | 3 | 4 | 3 | 2 | 4 | 2 | 3 | 2 | 2 | 3 | 3 | 1 | 3 |
| Georgia | 26 | 66 | 1 | 4 | 1 | 1 | 2 | 2 | 4 | 1 | 2 | 2 | 3 | 1 | 2 | 4 | 3 | 3 | 4 | 4 | 4 | 2 | 3 | 4 | 2 | 4 | 3 |
| Indiana | 27 | 65 | 1 | 3 | 1 | 1 | 2 | 3 | 4 | 4 | 2 | 2 | 3 | 2 | 3 | 4 | 2 | 2 | 4 | 2 | 4 | 3 | 3 | 4 | 2 | 2 | 2 |
| Kansas | 28 | 65 | 2 | 2 | 2 | 2 | 3 | 3 | 3 | 2 | 2 | 2 | 3 | 1 | 2 | 4 | 2 | 3 | 4 | 3 | 2 | 2 | 3 | 3 | 3 | 4 | 3 |
| Missouri | 29 | 65 | 2 | 3 | 1 | 1 | 2 | 3 | 4 | 2 | 2 | 1 | 2 | 1 | 2 | 4 | 2 | 4 | 4 | 4 | 4 | 3 | 3 | 4 | 2 | 2 | 3 |
| New Mexico | 30 | 65 | 2 | 2 | 2 | 1 | 2 | 4 | 4 | 3 | 2 | 2 | 4 | 2 | 2 | 4 | 3 | 2 | 3 | 3 | 4 | 3 | 3 | 1 | 3 | 2 | 2 |
| Oregon | 31 | 65 | 3 | 3 | 2 | 1 | 3 | 4 | 2 | 3 | 3 | 2 | 3 | 2 | 2 | 3 | 3 | 3 | 2 | 1 | 4 | 2 | 3 | 4 | 2 | 3 | 2 |
| Arizona | 32 | 64 | 2 | 3 | 1 | 1 | 3 | 2 | 3 | 2 | 3 | 2 | 3 | 1 | 2 | 4 | 1 | 4 | 4 | 2 | 3 | 3 | 3 | 4 | 4 | 1 | 3 |
| California | 33 | 64 | 4 | 4 | 2 | 1 | 4 | 4 | 3 | 2 | 4 | 2 | 4 | 2 | 2 | 4 | 3 | 1 | 1 | 3 | 1 | 1 | 1 | 1 | 3 | 3 | 4 |
| Nevada | 34 | 63 | 2 | 2 | 1 | 1 | 3 | 2 | 4 | 3 | 2 | 1 | 3 | 3 | 2 | 3 | 3 | 2 | 2 | 3 | 3 | 3 | 3 | 4 | 3 | 2 | 3 |
| South Carolina | 35 | 63 | 1 | 3 | 1 | 1 | 2 | 3 | 4 | 2 | 2 | 3 | 1 | 1 | 2 | 4 | 2 | 3 | 4 | 3 | 4 | 3 | 3 | 2 | 3 | 3 | 3 |
| Florida | 36 | 62 | 2 | 4 | 2 | 1 | 3 | 2 | 4 | 3 | 3 | 1 | 3 | 1 | 2 | 3 | 1 | 4 | 2 | 2 | 3 | 1 | 3 | 4 | 3 | 3 | 2 |
| New Hampshire | 37 | 61 | 3 | 1 | 2 | 1 | 3 | 2 | 2 | 3 | 2 | 3 | 3 | 2 | 3 | 4 | 3 | 3 | 4 | 3 | 2 | 3 | 2 | 1 | 2 | 2 | 2 |
| Tennessee | 38 | 59 | 1 | 2 | 1 | 1 | 1 | 1 | 4 | 2 | 2 | 1 | 4 | 2 | 2 | 4 | 3 | 1 | 4 | 3 | 3 | 2 | 3 | 3 | 3 | 3 | 3 |
| Oklahoma | 39 | 58 | 1 | 3 | 1 | 1 | 1 | 2 | 3 | 2 | 2 | 2 | 4 | 2 | 2 | 3 | 2 | 3 | 3 | 2 | 3 | 2 | 3 | 3 | 2 | 3 | 3 |
| Wyoming | 40 | 58 | 2 | 1 | 2 | 2 | 2 | 3 | 3 | 3 | 2 | 3 | 3 | 2 | 3 | 2 | 2 | 3 | 2 | 3 | 3 | 1 | 3 | 1 | 1 | 3 | 3 |
| Delaware | 41 | 57 | 1 | 1 | 2 | 1 | 3 | 1 | 4 | 3 | 2 | 2 | 3 | 2 | 2 | 4 | 2 | 2 | 2 | 1 | 3 | 3 | 3 | 2 | 3 | 2 | 3 |
| Kentucky | 42 | 57 | 2 | 2 | 1 | 1 | 1 | 3 | 4 | 3 | 1 | 2 | 3 | 1 | 2 | 4 | 1 | 3 | 3 | 3 | 3 | 2 | 2 | 2 | 2 | 3 | 3 |
| Maine | 43 | 57 | 2 | 1 | 2 | 1 | 2 | 2 | 4 | 2 | 2 | 2 | 2 | 1 | 2 | 3 | 3 | 2 | 3 | 2 | 2 | 2 | 3 | 4 | 3 | 2 | 3 |
| Montana | 44 | 56 | 3 | 1 | 2 | 1 | 3 | 4 | 2 | 3 | 2 | 3 | 1 | 1 | 2 | 2 | 2 | 1 | 3 | 2 | 3 | 1 | 2 | 4 | 2 | 3 | 3 |
| Alabama | 45 | 55 | 1 | 3 | 1 | 1 | 2 | 1 | 4 | 2 | 1 | 2 | 3 | 2 | 2 | 3 | 2 | 2 | 4 | 2 | 2 | 1 | 2 | 2 | 3 | 4 | 3 |
| Alaska | 46 | 55 | 4 | 1 | 2 | 3 | 2 | 2 | 2 | 3 | 2 | 2 | 4 | 3 | 2 | 2 | 4 | 1 | 1 | 2 | 3 | 2 | 2 | 1 | 2 | 1 | 2 |
| Texas | 47 | 53 | 2 | 4 | 1 | 1 | 3 | 2 | 3 | 2 | 3 | 2 | 3 | 1 | 2 | 1 | 1 | 1 | 3 | 3 | 3 | 2 | 3 | 1 | 2 | 1 | 3 |
| Mississippi | 48 | 51 | 1 | 2 | 1 | 1 | 1 | 3 | 3 | 3 | 1 | 2 | 2 | 2 | 2 | 2 | 2 | 2 | 1 | 3 | 2 | 2 | 2 | 2 | 3 | 3 | 3 |
| Louisiana | 49 | 46 | 1 | 2 | 1 | 1 | 2 | 3 | 2 | 2 | 1 | 1 | 1 | 1 | 1 | 1 | 1 | 2 | 3 | 2 | 2 | 2 | 3 | 2 | 3 | 4 | 2 |
| West Virginia | 50 | 45 | 1 | 1 | 1 | 1 | 1 | 2 | 4 | 3 | 1 | 2 | 1 | 1 | 2 | 1 | 1 | 3 | 2 | 3 | 2 | 1 | 2 | 2 | 2 | 1 | 4 |
| Arkansas | 51 | 42 | 1 | 2 | 1 | 1 | 1 | 3 | 4 | 1 | 1 | 2 | 1 | 1 | 2 | 2 | 1 | 2 | 2 | 1 | 1 | 1 | 3 | 1 | 2 | 2 | 3 |
Top 5 States with the BEST/WORST Dental Health
Percentage of Adults with a Dental Visit in the Past Year:
- Top Rank: Connecticut – 76%
- Bottom Rank: Mississippi – 54%
Percentage of Children with Preventive Dental Care:
- Top Rank: Hawaii – 85%
- Bottom Rank: Nevada – 71%
Water Fluoridation:
- Top Rank: Kentucky – 99%
- Bottom Rank: Hawaii – 8%
Smokers:
- Top Rank: Utah – 8%
- Bottom Rank: West Virginia – 24%
Percentage of People who Cited “Trouble Finding a Dentist” as a Reason for Not Getting Dental Care:
- Top Rank: Alabama – 5%
- Bottom Rank: Minnesota – 28%
Percentage of older adults (65+) with all teeth removed due to decay or gum disease:
- Top Rank: Hawaii – 6%
- Bottom Rank: West Virginia – 26%
Percentage of People who Cited “Cost” as a Reason for Not Getting Dental Care:
- Top Rank: Hawaii – 8%
- Bottom Rank: Texas – 18%
Dissatisfied with Life Due to Oral Health:
- Top Rank: North Dakota – 2%
- Bottom Rank: Tennessee – 14%
Poor Overall Condition of Mouth and Teeth:
- Top Rank: Alaska – 5%
- Bottom Rank: Louisiana – 16%
Indicators
Each indicator from the list of 25 is worth 4 points for a maximum total score of 100. We’ve included data not only from all income levels combined but also low-income levels, so that states that provide good dental care for all their citizens gain points in the league table. We’ve also included state-controlled indicators like dental benefits for Medicaid enrollees and water fluoridation. On the individual level, key indicators of dental habits include the percentage of all adults who visited a dentist, dentist visits by young adults, and preventive dental visits in children.
Availability of Dental Care
6 indicators
- Number of dentists per 100,000 people
- Employment of dentists
- Reason for not visiting the dentist among those without a visit in the past 12 months – Cost
- Reason for not visiting a dentist among those without a visit in the last 12 months – Trouble finding a dentist
- Medicaid adult dental benefits
- Water fluoridation

Dental Habits
6 indicators

- Percentage of all adults who visited a dentist in the past year
- Percentage of young adults who visited a dentist in the past year
- Percentage of adults who reported smoking at least 100 cigarettes in their lifetime and currently smoke daily or some days
- Strongly agree with I need to see the dentist twice a year among all income groups
- Reason for not visiting a dentist among those without a visit in the last 12 months – Afraid of dentist
Oral Health Status
13 indicators
- Percentage of adults aged 65 or older who reported having all teeth removed due to decay or gum disease
- Poor overall condition of mouth and teeth among all income levels
- Poor overall condition of mouth and teeth among low-income level
- Very good overall condition of mouth and teeth among all income levels
- Life in general is very often less satisfying due to condition of mouth and teeth among all income levels
- Life in general is very often less satisfying due to condition of mouth and teeth among low-income level
- Life in general is never less satisfying due to condition of mouth and teeth among high-income level
- Appearance of mouth and teeth affects ability to interview for a job among all income levels
- Appearance of mouth and teeth affects ability to interview for a job among low-income level
- Experienced dry mouth very often in the last 12 months due to condition of mouth and teeth among all income groups
- Experienced difficulty biting/chewing very often in the last 12 months due to condition of mouth and teeth among all income groups
- Experienced pain very often in the last 12 months due to condition of mouth and teeth among all income groups
- Took days off very often in the last 12 months due to condition of mouth and teeth among all income groups
Methodology
4 point | 3 point | 2 point | 1 point | |
|---|---|---|---|---|
Number of dentists per 100,000 people | Over 70 | 60-70 | 50-60 | Less than 50 |
Emplayment levels in dentists | 2390-12040 | 1230-2190 | 470-1130 | 100-420 |
Percentage of adults who reported visiting a dentist in the past year | Over 75% | 70-75% | 65-70% | Less than 65% |
Percentage of young adults (ages 18 to 44) who reported visiting a dentist in the past year | Over 75% | 70-75% | 65-70% | Less than 65 |
Percentage of adults aged 65 or older who reported having all teeth removed due to decay or gum disease | Less than 10% | 10-15% | 15-20% | Over 20% |
Medicaid Adult Dental Benefits | Extensive | Limited | Emergency | None |
Water Fluoridation | Over 75% | 50-75% | 25-50% | Less than 25% |
Reason for not visiting the dentist among those without a visit in the past 12 months – Cost | Less than 50% | 51-60% | 61-70% | 71% or more |
Percentage of adults who reported smoking at least 100 cigarettes in their lifetime and currently smoke daily or some days | Less than 10% | 10-15% | 15-20% | More than 20% |
Percentage of children ages 1-17 who had one or more preventive dental care visits in the past 12 months | More than 85% | 80-85% | 75-80% | Less than 75% |
Poor overall condition of mouth and teeth among all income levels | Less than 7% | 8-10% | 11-13% | Over 13% |
Poor overall condition of mouth and teeth among low-income level | Less than 9% | 10-15% | 16-20% | Over 21% |
Very good overall condition of mouth and teeth among all income levels | 45% or more | 33-44% | 21-32% | 20% or less |
Life in general is very often less satisfying due to condition of mouth and teeth among all income levels | 7% or less | 8-9% | 10-11% | 12% or more |
Life in general is very often less satisfying due to condition of mouth and teeth among low income levels | 5% or less | 6-11% | 12-17% | 18% or more |
Life in general is never less satisfying due to condition of mouth and teeth among high-income level | 61% or more | 51-60% | 41-50% | 40% or less |
Appearance of mouth and teeth affects ability to interview for a job among all income levels | 61% or more | 51-60% | 41-50% | 40% or less |
Appearance of mouth and teeth affects ability to interview for a job among low-income level | 20% or less | 21-30% | 31-40% | 41% or more |
Experienced dry mouth very often in the last 12 months due to condition of mouth and teeth among all income groups | 10% or less | 11-14% | 15-18% | 19% or more |
Experienced difficulty biting/chewing very often in the last 12 months due to condition of mouth and teeth among all income groups | 6% or less | 7-10% | 15-14% | 15% or more |
Experienced pain very often in the last 12 months due to condition of mouth and teeth among all income groups | 5% or less | 6-9% | 10-13% | 14% or more |
Took days off very often in the last 12 months due to condition of mouth and teeth among all income groups | 0-1% | 2% | 3% | 4% or more |
Strongly agree with I need to see the dentist twice a year among all income groups | 71% or more | 61-70% | 51-60% | 50% or less |
Reason for not visiting a dentist among those without a visit in the last 12 months – Trouble finding a dentist | 8% or less | 9-13% | 14-18% | 19% or more |
Reason for not visiting a dentist among those without a visit in the last 12 months – Afraid of dentist | 15% or less | 16-25% | 26-35% | 36% or more |
References
- Number of Dentists per 100,000 https://www.ncbi.nlm.nih.gov/books/NBK569311/table/ch3.tab42/
- Employment levels in dentists https://www.bls.gov/oes/current/oes291021.htm#st
- Percentage of adults who reported visiting a dentist in the past year https://www.americashealthrankings.org/explore/annual/measure/dental/state/ALL
- Percentage of young adults (ages 18 to 44) who reported visiting a dentist in the past year https://www.americashealthrankings.org/explore/annual/measure/dental/population/dental_visit_18_44/state/ALL
- Percentage of adults aged 65 or older who reported having all teeth removed due to decay or gum disease https://www.americashealthrankings.org/explore/senior/measure/teeth_extractions_sr/state/ALL
- Medicaid Adult Dental Benefits https://www.chcs.org/media/Medicaid-Adult-Dental-Benefits-Overview-Appendix_091519.pdf
- Water fluoridation https://www.americashealthrankings.org/explore/health-of-women-and-children/measure/water_fluoridation/state/ALL
- Percentage of adults who reported in the past 12 months needing care but who avoided care due to cost https://www.americashealthrankings.org/explore/annual/measure/costburden/state/ALL
- Percentage of adults who reported smoking at least 100 cigarettes in their lifetime and currently smoke daily or some days https://www.americashealthrankings.org/explore/annual/measure/Smoking/state/ALL
- Percentage of children ages 1-17 who had one or more preventive dental care visits in the past 12 months https://www.americashealthrankings.org/explore/health-of-women-and-children/measure/prev_dent_care/state/ALL
- Poor overall condition of mouth and teeth in all income levels https://www.ada.org/-/media/project/ada-organization/ada/ada-org/files/resources/research/hpi/oral-health-well-being-data-tables.xlsx
- Poor overall condition of mouth and teeth in low-income level https://www.ada.org/-/media/project/ada-organization/ada/ada-org/files/resources/research/hpi/oral-health-well-being-data-tables.xlsx
- Very good overall condition of mouth and teeth in all income levels https://www.ada.org/-/media/project/ada-organization/ada/ada-org/files/resources/research/hpi/oral-health-well-being-data-tables.xlsx
- Life in general is very often less satisfying due to condition of mouth and teeth among all income levels https://www.ada.org/-/media/project/ada-organization/ada/ada-org/files/resources/research/hpi/oral-health-well-being-data-tables.xlsx
- Life in general is very often less satisfying due to condition of mouth and teeth among low-income level https://www.ada.org/-/media/project/ada-organization/ada/ada-org/files/resources/research/hpi/oral-health-well-being-data-tables.xlsx
- Life in general is never less satisfying due to condition of mouth and teeth among high-income level https://www.ada.org/-/media/project/ada-organization/ada/ada-org/files/resources/research/hpi/oral-health-well-being-data-tables.xlsx
- Appearance of mouth and teeth affects ability to interview for a job among all income levels https://www.ada.org/-/media/project/ada-organization/ada/ada-org/files/resources/research/hpi/oral-health-well-being-data-tables.xlsx
- Appearance of mouth and teeth affects ability to interview for a job among low-income level https://www.ada.org/-/media/project/ada-organization/ada/ada-org/files/resources/research/hpi/oral-health-well-being-data-tables.xlsx
- Experienced dry mouth very often in the last 12 months due to condition of mouth and teeth among all income groups https://www.ada.org/-/media/project/ada-organization/ada/ada-org/files/resources/research/hpi/oral-health-well-being-data-tables.xlsx
- Experienced difficulty biting/chewing very often in the last 12 months due to condition of mouth and teeth among all income groups https://www.ada.org/-/media/project/ada-organization/ada/ada-org/files/resources/research/hpi/oral-health-well-being-data-tables.xlsx
- Experience pain very often in the last 12 months due to condition of mouth and teeth among all income groups https://www.ada.org/-/media/project/ada-organization/ada/ada-org/files/resources/research/hpi/oral-health-well-being-data-tables.xlsx
- Experienced pain very often in the last 12 months due to condition of mouth and teeth among all income groups https://www.ada.org/-/media/project/ada-organization/ada/ada-org/files/resources/research/hpi/oral-health-well-being-data-tables.xlsx
- Took days off very often in the last 12 months due to condition of mouth and teeth among all income groups https://www.ada.org/-/media/project/ada-organization/ada/ada-org/files/resources/research/hpi/oral-health-well-being-data-tables.xlsx
- Reason for not visiting a dentist among those without a visit in the last 12 months – Trouble finding a dentist https://www.ada.org/-/media/project/ada-organization/ada/ada-org/files/resources/research/hpi/oral-health-well-being-data-tables.xlsx
- Reason for not visiting a dentist among those without a visit in the last 12 months – Afraid of dentist https://www.ada.org/-/media/project/ada-organization/ada/ada-org/files/resources/research/hpi/oral-health-well-being-data-tables.xlsx